Grok 4.7 on Bid Bench

Bid Bench evaluates Grok 4.7 in the context of heavy civil construction and estimating workflows.
The benchmark covers Documents, Takeoffs, Analysis, Knowledge, Apps and Predictions. Bid Bench 1.0 compares delivery quality across thinking settings, with forecasts and stopping behavior scored separately.
Completion limits the efficiency result
Grok 4.7 has one fixed setting in Bidlo. There are no additional app-supported thinking levels to compare.
No complete cost result for Grok 4.7. Available alternatives are plotted; all settings remain in the table.
| Model · Thinking | Pass | Cost¹ | Tokens² | Latency³ |
|---|---|---|---|---|
| 68.9% † | — | — | 48.8 s | |
| 70.0% | $0.17 | 8,450 | 6.9 s | |
| 100.0% | $9.83 | 21,906 | 17.6 s |
All 75 configurations · 18 models
| Model · Thinking | Pass | Cost¹ | Tokens² | Latency³ |
|---|---|---|---|---|
| 100.0% | $9.83 | 21,906 | 17.6 s | |
| 100.0% | $11.66 | 26,419 | 16.8 s | |
| 100.0% | $11.84 | 11,621 | 10.7 s | |
| 100.0% | $13.96 | 12,848 | 12.8 s | |
| 100.0% | $15.15 | 25,258 | 21.9 s | |
| 100.0% | $15.51 | 26,053 | 23.4 s | |
| 100.0% | $17.42 | 29,689 | 23.3 s | |
| 100.0% | $17.87 | 13,921 | 18.9 s | |
| 98.9% | $14.28 | 23,131 | 22.8 s | |
| 98.9% | — | — | 22.2 s | |
| 98.9% | — | — | 27.7 s | |
| 97.8% | — | — | 11.7 s | |
| 96.7% | $8.70 | 21,280 | 14.4 s | |
| 96.7% | — | — | 17.1 s | |
| 95.6% | $6.24 | 16,797 | 13.1 s | |
| 95.6% † | — | — | 31.3 s | |
| 95.6% | — | — | 15.8 s | |
| 95.6% | — | — | 13.5 s | |
| 94.4% | $2.33 | 12,034 | 7.4 s | |
| 94.4% | $2.91 | 13,383 | 10.4 s | |
| 94.4% | $4.93 | 19,705 | 10.9 s | |
| 94.4% | — | — | 32.8 s | |
| 94.4% | — | — | 31.5 s | |
| 93.3% | — | — | 32.8 s | |
| 93.3% † | — | — | 31.2 s | |
| 93.3% | — | — | 30.3 s | |
| 92.2% | — | — | 35.5 s | |
| 92.2% | — | — | 33.5 s | |
| 92.2% † | — | — | 29.7 s | |
| 92.2% | — | — | 19.3 s | |
| 92.2% | — | — | 18.2 s | |
| 91.1% | — | — | 35.0 s | |
| 90.0% | — | — | 31.5 s | |
| 90.0% | — | — | 24.5 s | |
| 88.9% | — | — | 35.6 s | |
| 88.9% | — | — | 11.5 s | |
| 87.8% | — | — | 11.5 s | |
| 86.7% | $4.34 | 17,737 | 9.4 s | |
| 85.6% | $3.77 | 15,669 | 8.6 s | |
| 85.6% | — | — | 49.3 s | |
| 84.4% | $7.84 | 19,566 | 9.1 s | |
| 83.3% | $3.08 | 17,675 | 7.9 s | |
| 83.3% † | — | — | 23.1 s | |
| 81.1% | — | — | 51.7 s | |
| 81.1% | — | — | 39.1 s | |
| 81.1% | — | — | 13.6 s | |
| 78.9% | $0.22 | 15,802 | 9.6 s | |
| 78.9% | $0.25 | 15,844 | 10.0 s | |
| 78.9% | $0.84 | 27,834 | 16.0 s | |
| 78.9% | — | — | 41.3 s | |
| 78.9% | — | — | 66.6 s | |
| 78.9% | — | — | 27.3 s | |
| 76.7% † | — | — | 42.8 s | |
| 75.6% † | — | — | 38.8 s | |
| 74.4% | — | — | 53.0 s | |
| 73.3% | $0.46 | 12,354 | 13.9 s | |
| 70.0% | $0.17 | 8,450 | 6.9 s | |
| 68.9% † | — | — | 48.8 s | |
| 67.8% | — | — | 67.3 s | |
| 65.6% | $5.01 | 13,514 | 4.7 s | |
| 65.6% | — | — | 6.4 s | |
| 63.3% | — | — | 26.7 s | |
| 63.3% | — | — | 19.7 s | |
| 57.8% | $3.22 | 47,659 | 13.3 s | |
| 57.8% | — | — | 36.8 s | |
| 56.7% | $0.26 | 20,711 | 8.0 s | |
| 56.7% | $0.57 | 13,523 | 4.6 s | |
| 47.8% | — | — | 78.1 s | |
| 46.7% | $4.52 | 47,105 | 13.5 s | |
| 46.7% | $6.49 | 66,166 | 30.4 s | |
| 44.4% † | — | — | 46.2 s | |
| 37.8% † | — | — | 26.8 s | |
| 34.4% † | — | — | 11.1 s | |
| 32.2% † | — | — | 29.3 s | |
| 31.1% † | — | — | 25.1 s |
¹ USD per 100 accepted delivery tasks, including failed attempts. ² Mean input + output tokens per attempt. ³ Median seconds on accepted tasks. Missing telemetry is shown as —. Forecasts and judgment are scored separately.
† Includes attempts interrupted by our test host. These do not establish a reasoning error.
Grok 4.7 · Fixed: 62/90 passed. Case-resampling interval 57.8–78.9%. Incomplete cost telemetry; 48.8 s median on accepted tasks. 1 test-host interruption was counted as unsuccessful.
Results JSON · CSV · Method · September 28, 2026 UTC
It passes 62/90 delivery attempts, or 68.9%. Median accepted completion takes 48.8 seconds. Service and execution failures leave complete cost and token totals unknown; the Cost and Tokens views show measured alternatives. Of the 28 unsuccessful delivery attempts, 22 are service errors, five reach an execution budget and one loses its receipt during a test-host interruption. These are not 28 established reasoning mistakes.
Takeoffs are stronger than Apps
The overall result hides a wide difference between completing schedule calculations and building executable tools.
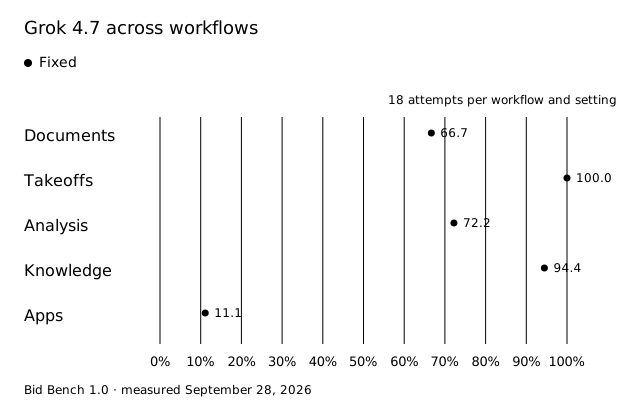
Documents. Grok passes 12/18 reconciliation attempts. Large document cases contribute to the missing completions.
Takeoffs. It passes all 18 schedule-based quantity checks, including the hardest geometry and material-conversion case. Drawing recognition is outside this edition.
Analysis. It passes 13/18 field-selection and calculation attempts. Historical filters and record revisions are tested alongside simpler queries.
Knowledge. It passes 17/18 construction and estimating scenarios. The remaining attempt is part of the execution failures described above.
Apps. Only 2/18 attempts produce an accepted function. This is the largest practical weakness under the shared five-minute, eight-step budget.
Forecast coverage is incomplete
A forecast must return every required batch before we plot a complete error result.
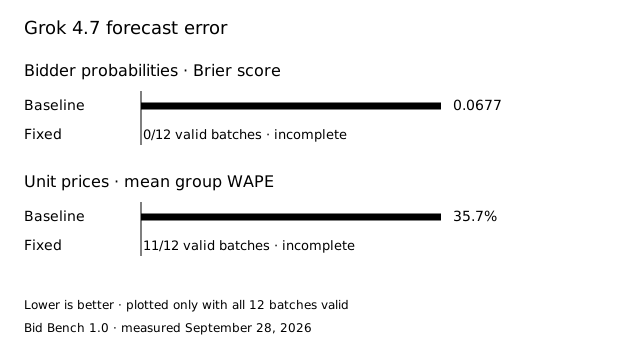
The candidate panels cover 18 of 61 actual bidder/project appearances. Bidder error measures only that restricted panel.
None of Grok’s 12 bidder batches succeeds: the requests end in service errors. Eleven of 12 price batches are valid. On that subset, mean group price error is 37.7%, equal to the historical baseline on the same subset. Comparing it with the full-cohort baseline of 35.7% would be misleading. There is no complete forecast result for either metric.
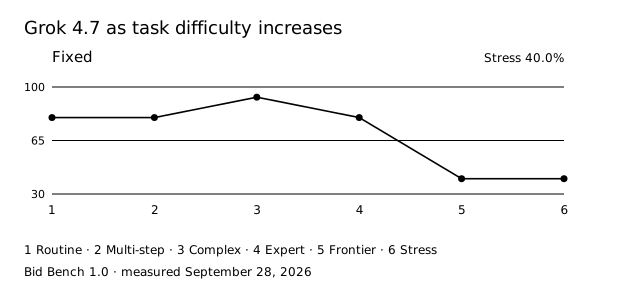
Harder work exposes the execution limit
Grok completes 6/15 attempts at both Frontier and Stress. The easier tiers also have missing completions, so the curve reflects serving reliability and tool execution as well as task complexity.
All 12 deliberately blocked tasks are identified correctly, with no false stops on solvable work. Median time to a correct stop is 9.8 seconds. That stopping result does not offset the low rate of completed app-building tasks.
| Thinking | Correct stops | False stops | Stop time |
|---|---|---|---|
| Fixed | 12/12 | 0/90 | 9.8 s |
False stops abandon solvable delivery tasks. Time is the median for correct stops, excluding timeouts.
Method
Each setting receives 30 delivery cases, repeated three times with frozen inputs, tools and acceptance checks. Cost includes failed attempts; tokens are input plus output per attempt; latency is the median for accepted results. Unknown complete cost or token measurements remain blank. These are controlled text, schedule and function tests, not scanned-plan takeoffs or the full Bidlo app. Method, uncertainty and source corrections · JSON · CSV.
Choosing a setting
Grok is strongest on the supplied takeoff schedules and knowledge questions. Its application-building completion and service reliability limit the broader result. Under this harness, Sol Low delivers more accepted work in less time. Grok needs a more reliable complete run before a cost-efficiency recommendation or forecasting claim is justified.