GPT-6 Luna on Bid Bench

Bid Bench evaluates GPT-6 Luna in the context of heavy civil construction and estimating workflows.
The benchmark covers Documents, Takeoffs, Analysis, Knowledge, Apps and Predictions. Bid Bench 1.0 compares delivery quality across thinking settings, with forecasts and stopping behavior scored separately.
Low cost comes with more failures
Delivery scores weight the first five workflows equally.
Measured thinking settings and selected alternatives · Logarithmic horizontal axis · 2 missing measurements retained in the table
| Model · Thinking | Pass | Cost¹ | Tokens² | Latency³ |
|---|---|---|---|---|
| 56.7% | $0.26 | 20,711 | 8.0 s | |
| 70.0% | $0.17 | 8,450 | 6.9 s | |
| 78.9% | $0.22 | 15,802 | 9.6 s | |
| 78.9% | $0.25 | 15,844 | 10.0 s | |
| 88.9% | — | — | 11.5 s | |
| 92.2% | — | — | 18.2 s | |
| 73.3% | $0.46 | 12,354 | 13.9 s | |
| 100.0% | $9.83 | 21,906 | 17.6 s | |
| 78.9% | $0.84 | 27,834 | 16.0 s |
All 75 configurations · 18 models
| Model · Thinking | Pass | Cost¹ | Tokens² | Latency³ |
|---|---|---|---|---|
| 100.0% | $9.83 | 21,906 | 17.6 s | |
| 100.0% | $11.66 | 26,419 | 16.8 s | |
| 100.0% | $11.84 | 11,621 | 10.7 s | |
| 100.0% | $13.96 | 12,848 | 12.8 s | |
| 100.0% | $15.15 | 25,258 | 21.9 s | |
| 100.0% | $15.51 | 26,053 | 23.4 s | |
| 100.0% | $17.42 | 29,689 | 23.3 s | |
| 100.0% | $17.87 | 13,921 | 18.9 s | |
| 98.9% | $14.28 | 23,131 | 22.8 s | |
| 98.9% | — | — | 22.2 s | |
| 98.9% | — | — | 27.7 s | |
| 97.8% | — | — | 11.7 s | |
| 96.7% | $8.70 | 21,280 | 14.4 s | |
| 96.7% | — | — | 17.1 s | |
| 95.6% | $6.24 | 16,797 | 13.1 s | |
| 95.6% † | — | — | 31.3 s | |
| 95.6% | — | — | 15.8 s | |
| 95.6% | — | — | 13.5 s | |
| 94.4% | $2.33 | 12,034 | 7.4 s | |
| 94.4% | $2.91 | 13,383 | 10.4 s | |
| 94.4% | $4.93 | 19,705 | 10.9 s | |
| 94.4% | — | — | 32.8 s | |
| 94.4% | — | — | 31.5 s | |
| 93.3% | — | — | 32.8 s | |
| 93.3% † | — | — | 31.2 s | |
| 93.3% | — | — | 30.3 s | |
| 92.2% | — | — | 35.5 s | |
| 92.2% | — | — | 33.5 s | |
| 92.2% † | — | — | 29.7 s | |
| 92.2% | — | — | 19.3 s | |
| 92.2% | — | — | 18.2 s | |
| 91.1% | — | — | 35.0 s | |
| 90.0% | — | — | 31.5 s | |
| 90.0% | — | — | 24.5 s | |
| 88.9% | — | — | 35.6 s | |
| 88.9% | — | — | 11.5 s | |
| 87.8% | — | — | 11.5 s | |
| 86.7% | $4.34 | 17,737 | 9.4 s | |
| 85.6% | $3.77 | 15,669 | 8.6 s | |
| 85.6% | — | — | 49.3 s | |
| 84.4% | $7.84 | 19,566 | 9.1 s | |
| 83.3% | $3.08 | 17,675 | 7.9 s | |
| 83.3% † | — | — | 23.1 s | |
| 81.1% | — | — | 51.7 s | |
| 81.1% | — | — | 39.1 s | |
| 81.1% | — | — | 13.6 s | |
| 78.9% | $0.22 | 15,802 | 9.6 s | |
| 78.9% | $0.25 | 15,844 | 10.0 s | |
| 78.9% | $0.84 | 27,834 | 16.0 s | |
| 78.9% | — | — | 41.3 s | |
| 78.9% | — | — | 66.6 s | |
| 78.9% | — | — | 27.3 s | |
| 76.7% † | — | — | 42.8 s | |
| 75.6% † | — | — | 38.8 s | |
| 74.4% | — | — | 53.0 s | |
| 73.3% | $0.46 | 12,354 | 13.9 s | |
| 70.0% | $0.17 | 8,450 | 6.9 s | |
| 68.9% † | — | — | 48.8 s | |
| 67.8% | — | — | 67.3 s | |
| 65.6% | $5.01 | 13,514 | 4.7 s | |
| 65.6% | — | — | 6.4 s | |
| 63.3% | — | — | 26.7 s | |
| 63.3% | — | — | 19.7 s | |
| 57.8% | $3.22 | 47,659 | 13.3 s | |
| 57.8% | — | — | 36.8 s | |
| 56.7% | $0.26 | 20,711 | 8.0 s | |
| 56.7% | $0.57 | 13,523 | 4.6 s | |
| 47.8% | — | — | 78.1 s | |
| 46.7% | $4.52 | 47,105 | 13.5 s | |
| 46.7% | $6.49 | 66,166 | 30.4 s | |
| 44.4% † | — | — | 46.2 s | |
| 37.8% † | — | — | 26.8 s | |
| 34.4% † | — | — | 11.1 s | |
| 32.2% † | — | — | 29.3 s | |
| 31.1% † | — | — | 25.1 s |
¹ USD per 100 accepted delivery tasks, including failed attempts. ² Mean input + output tokens per attempt. ³ Median seconds on accepted tasks. Missing telemetry is shown as —. Forecasts and judgment are scored separately.
† Includes attempts interrupted by our test host. These do not establish a reasoning error.
GPT-6 Luna · Medium: 71/90 passed. Case-resampling interval 68.9–88.9%. $0.22 per 100 accepted; 9.6 s median on accepted tasks.
Results JSON · CSV · Method · September 28, 2026 UTC
Low passes 63/90 attempts at $0.17 per 100 accepted tasks. Medium improves to 71/90 at $0.22. High also passes 71/90, with slightly more tokens and time. Max reaches 83/90, but incomplete telemetry prevents a complete cost comparison. Median accepted latency rises from 6.9 seconds at Low to 18.2 at Max.
Thinking helps some workflows more
Knowledge improves early; reliable record analysis needs more thinking in this set.
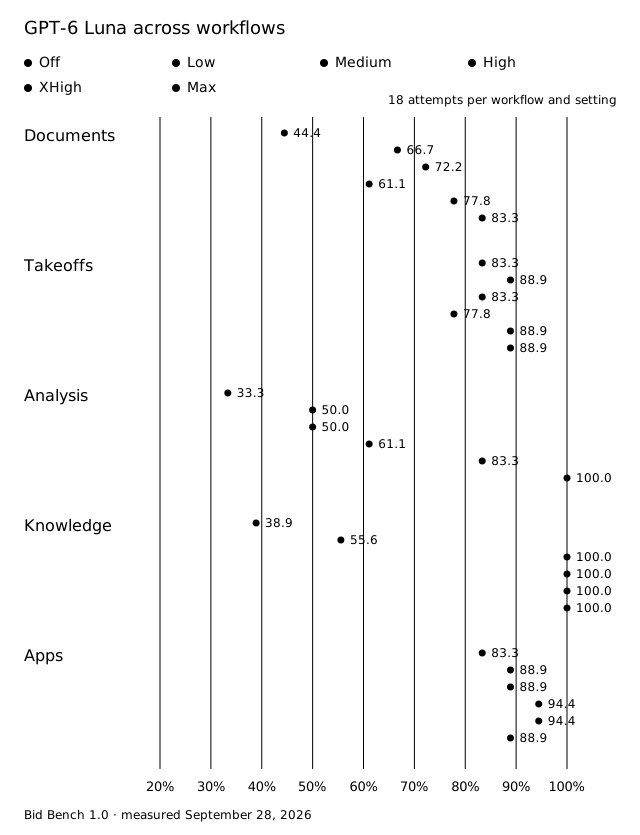
Documents. Low passes 12/18 and Medium 13/18. Max reaches 15/18, leaving document reconciliation short of full completion.
Takeoffs. Low and Max both pass 16/18. An inspected Off response divides by 27 twice when converting cubic feet to cubic yards; additional thinking does not eliminate every quantity error.
Analysis. Low and Medium pass 9/18; Max reaches 18/18. An inspected Medium answer selects the wrong eligible winning bid.
Knowledge. Medium through Max pass 18/18, compared with Low’s 10/18. This is the clearest early gain from thinking.
Apps. Low and Medium pass 16/18; High and XHigh reach 17/18. Max returns to 16/18, so the highest setting is not uniformly strongest.
Forecasts do not beat the baselines
Bidder probabilities and comparable item prices are checked against recorded outcomes.
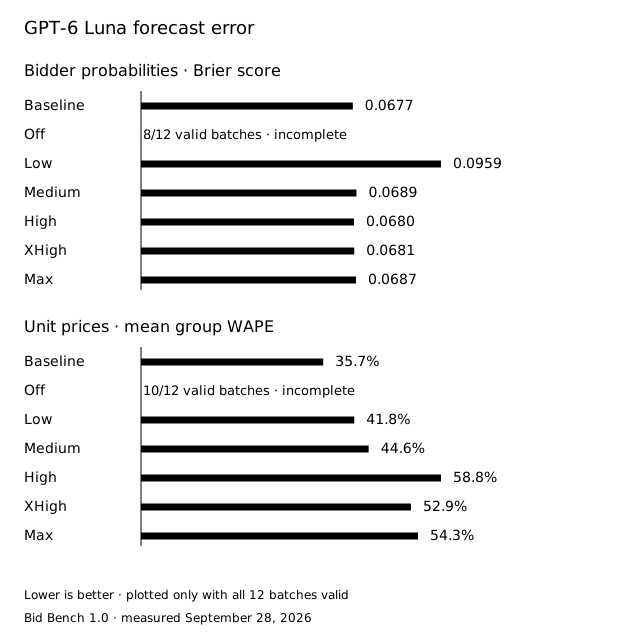
The candidate panels cover 18 of 61 actual bidder/project appearances. Bidder error measures only that restricted panel.
Among complete settings, High has the lowest bidder Brier score, 0.0680, versus the baseline’s 0.0677. Low has the lowest price error, 41.8%, versus 35.7%. Thinking Off supplies only 8/12 valid bidder batches and 10/12 price batches, so it has no complete forecast point. These retrospective results do not validate prospective prediction accuracy.
Hard cases benefit from higher settings
Stress completion rises from 1/15 with thinking Off to 7/15 at Medium and 12/15 at Max. Routine results are not uniformly perfect either.
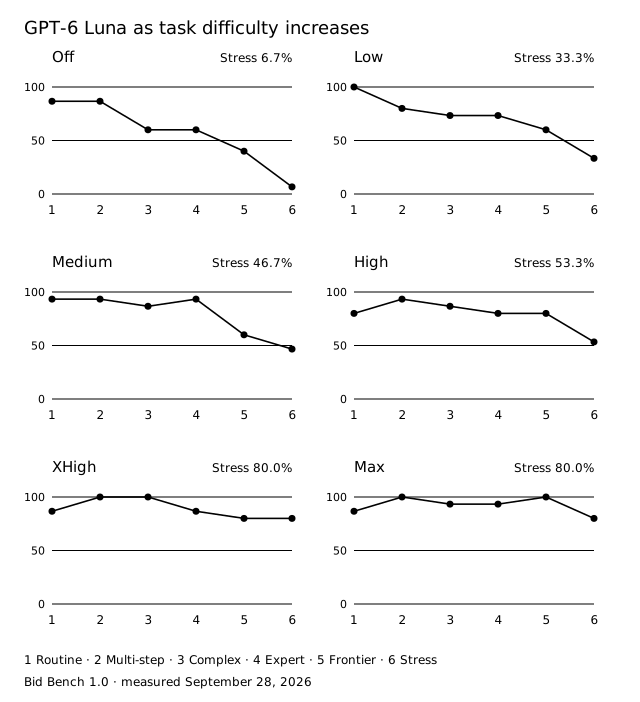
High through Max identify all 12 blocked tasks correctly. False stops fall from 12/90 with thinking Off to zero at Max. The trade-off is longer time to a correct stop.
| Thinking | Correct stops | False stops | Stop time |
|---|---|---|---|
| Off | 9/12 | 12/90 | 1.7 s |
| Low | 11/12 | 10/90 | 3.6 s |
| Medium | 10/12 | 3/90 | 3.5 s |
| High | 12/12 | 3/90 | 3.7 s |
| XHigh | 12/12 | 1/90 | 4.6 s |
| Max | 12/12 | 0/90 | 6.1 s |
False stops abandon solvable delivery tasks. Time is the median for correct stops, excluding timeouts.
Method
Each setting receives 30 delivery cases, repeated three times with frozen inputs, tools and acceptance checks. Cost includes failed attempts; tokens are input plus output per attempt; latency is the median for accepted results. Unknown complete cost or token measurements remain blank. These are controlled text, schedule and function tests, not scanned-plan takeoffs or the full Bidlo app. Method, uncertainty and source corrections · JSON · CSV.
Choosing a setting
Luna fits work where low cost and explicit verification matter. Medium improves Knowledge substantially over Low; Max is stronger for Analysis. For fewer failed attempts, Sol Low reaches 94.4% at $2.33 per 100 accepted tasks, versus Luna Low’s 70.0% at $0.17. Those different failure rates matter more than token price alone.